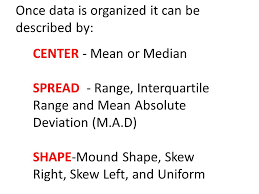
SP.2 - Understand that a set of data collected to answer a statistical question has a distribution which can be described by its center, spread, and overall shape.
|
Describe Data by Shape
|
warm-up
Directions: Click on the button below and complete questions 1 and 3.
mini lesson - independent work/share out/discussion
Directions: In teams of two, work together to complete these two difficult questions.
team challenge
Puppy Weights
Below are the 25 birth weights, in ounces, of all the Labrador Retriever puppies born at Kingston Kennels in the last six months.
(13, 14, 15, 15, 16, 16, 16, 16, 17,17, 17, 17, 17, 17, 17, 18, 18, 18, 18, 18, 18, 18, 18, 19, 20)
Below are the 25 birth weights, in ounces, of all the Labrador Retriever puppies born at Kingston Kennels in the last six months.
(13, 14, 15, 15, 16, 16, 16, 16, 17,17, 17, 17, 17, 17, 17, 18, 18, 18, 18, 18, 18, 18, 18, 19, 20)
- Use an appropriate graph to summarize these birth weights.
- Describe the distribution of birth weights for puppies born at Kingston Kennels in the last six months. Be sure to describe shape, center and variability.
- What is a typical birth weight for puppies born at Kingston Kennels in the last six months? Explain why you chose this value.
